Part 1 of 3 in a series reading Coatue’s October 2026 Public Markets Update. The other parts: Part 2: AI Beyond Software and Part 3: Does the Money Show Up. All charts and figures discussed come from Coatue’s own deck, which you can read at coatue.com. Coatue labels many of its slides illustrative or forward-looking, and so do I.
Coatue’s October public markets update has a slide titled “Moving from waves to ages.” It stacks four eras side by side: the Agrarian Age (10,000 BCE to 1750), the Industrial Age (1750 to 1950), the Information Age (1950 to 2020), and the Intelligence Age, which starts in 2020 and has a question mark where the duration should be.
The durations Coatue prints are 12,000 years, 200 years and 70 years. Each age lasted a fraction of the one before it, and each ended with a one-line summary: farms replaced foraging, machines replaced muscle, software replaced paperwork. The Intelligence Age gets “tokens replace work.”
That framing is a fund making a pitch, and it is worth reading as one. But the slides that follow it make a more interesting claim than the headline does. They try to say how you would know an age is real. Coatue’s answer is to measure each age by the thing it spends its money on.
The scarce input defines the age
Look at the lists under each era. The Agrarian Age is crops, irrigation, granaries. The Industrial Age is electricity, steam, factories. The Information Age is mainframes, networking, software, cloud. The Intelligence Age is GPUs, token factories and transformers.
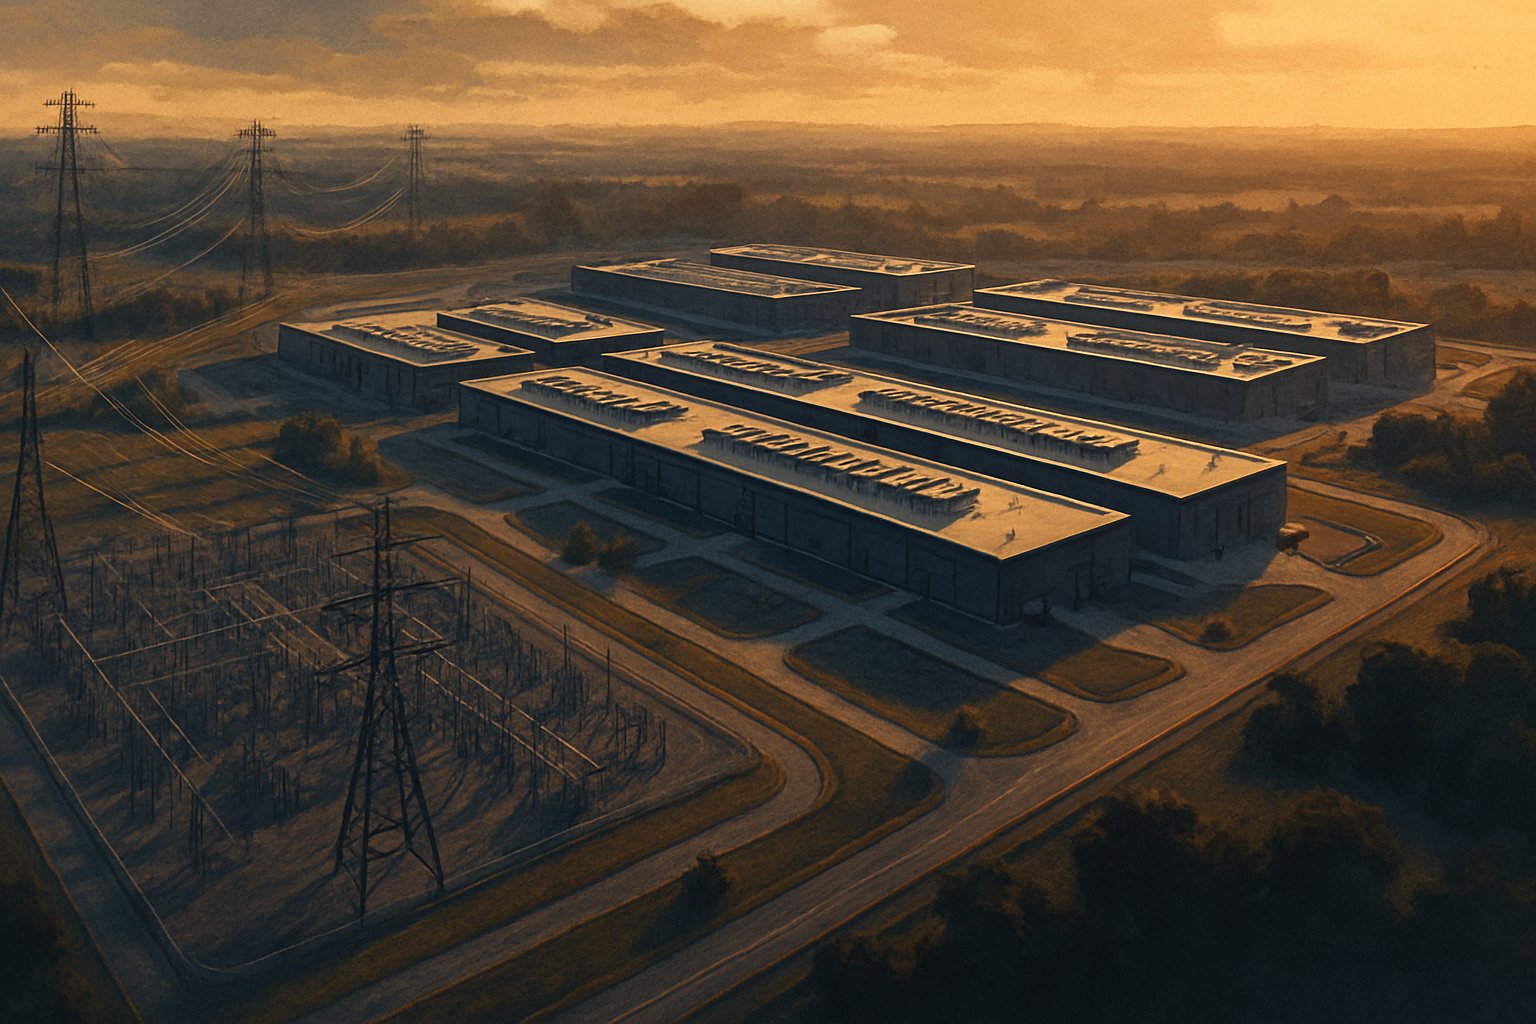
A later slide draws the token factory as a literal factory. Land, power and chips go in on the left (grid and permits, 24/7 electricity in gigawatts, GPUs and memory). Intelligence comes out on the right: answers, code, research, forecasts, agents, contracts. A companion slide puts it in one line: “Intelligence will be measured in gigawatts.” The old world has workers plus raw materials making goods. The new one has land, power and silicon making intelligence.
If you accept that, you can stop arguing about whether AI is “real” and ask a duller question that has an answer: how much of the economy’s investment is going into the factories?
What the capex slide shows
Coatue plots sector capital spending as a share of US GDP for each age’s defining build-out. Railroads peaked at 2.1% between 1897 and 1917. Oil and gas pipelines peaked at 2.0% in the 1980s. Fiber, in the 1990s and early 2000s, peaked at 1.4%, and so did shale in the decade after. AI data centers are plotted at 2.9%, and the line is dashed because the right-hand end is a Coatue forecast, not a measured number.
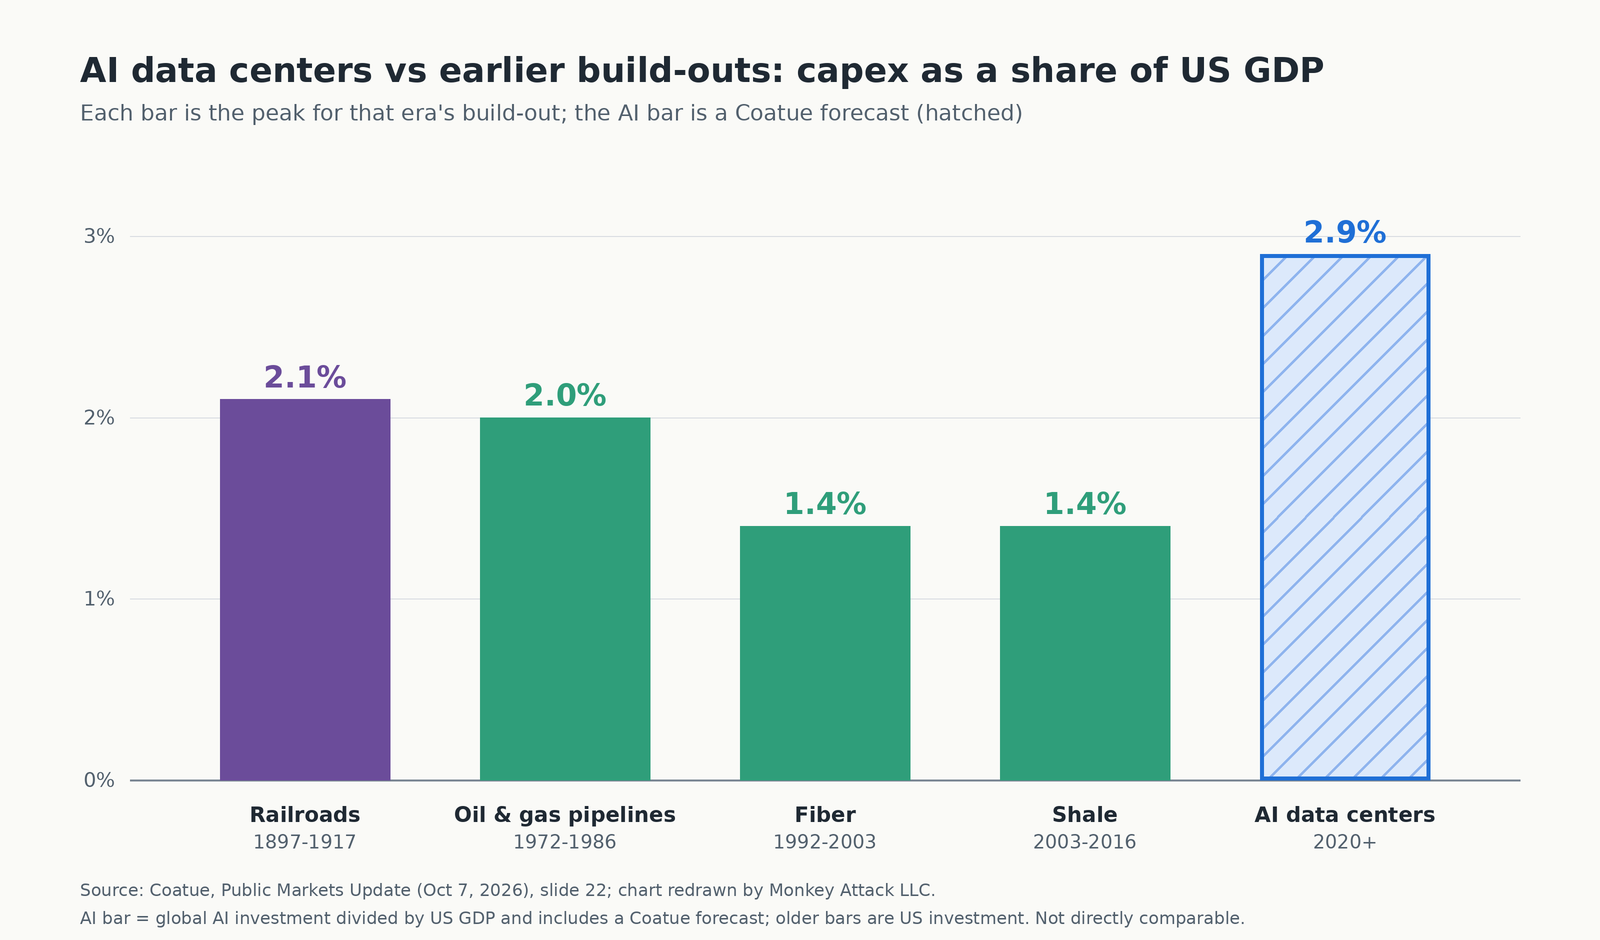
Two footnotes matter here, and the slide prints both. The AI figure is global investment divided by US GDP, while the older series are US investment. And the dashed section is a forecast. So the comparison is not clean. Even so, the direction is hard to wave away: on Coatue’s numbers the current build is already above the railroad peak, and it got there in a handful of years.
The part that cuts the other way
Coatue has a second slide that measures revenue as a share of GDP. Railroads took about 9% at their 1914 peak. Oil took about 8% in 1979. Semiconductors sit at about 2% today, which Coatue calls a 2026 estimate.
Read together, the two slides say something uncomfortable. The spending is already larger, as a share of the economy, than the railroads ever were. The revenue it generates is about a quarter of what the railroads or oil took at their peaks. That gap is either the head start of a much bigger age, or it is the shape of an overbuild.
Coatue’s own footnote warns that the semiconductor figure is global and “not directly comparable” to the historical US GDP percentages. That is fair. It also means nobody can honestly say how large the gap is, only that it exists.
What would count as proof
The deck has no slide titled “how we will know,” but you can assemble one from its own parts.
An age needs a bottleneck input that gets spent on at scale. Railroads had steel and right-of-way. Oil had wells and pipe. This age has gigawatts, which is why a slide about intelligence is full of land, grid and permits.
It needs the toll-takers to get rich first. Coatue’s chart of S&P 500 sector weights shows semiconductors at about 19% of market cap, against 26% for energy at the oil-shock peak and 22% for financials before the financial crisis. Memory chipmakers show operating margins of 76% in the second quarter, higher than exchanges, payment networks or tobacco.
And it needs revenue to follow the spending. This is the test that is still open. During the cloud build-out, Coatue says incremental revenue ran at about 60 cents per dollar of annual capex. For AI the same ratio is 9 cents in 2024 and 21 cents in 2026, and the deck’s own scenario only reaches 30 cents by 2030. They label the gap “AGI gap?”
The honest reading
An age is not decided by a slide. Coatue invests in this thesis, the historical comparisons mix geographies and definitions, and the forward numbers are scenarios the firm chose to draw. Every chart in the deck carries a disclosure line saying so.
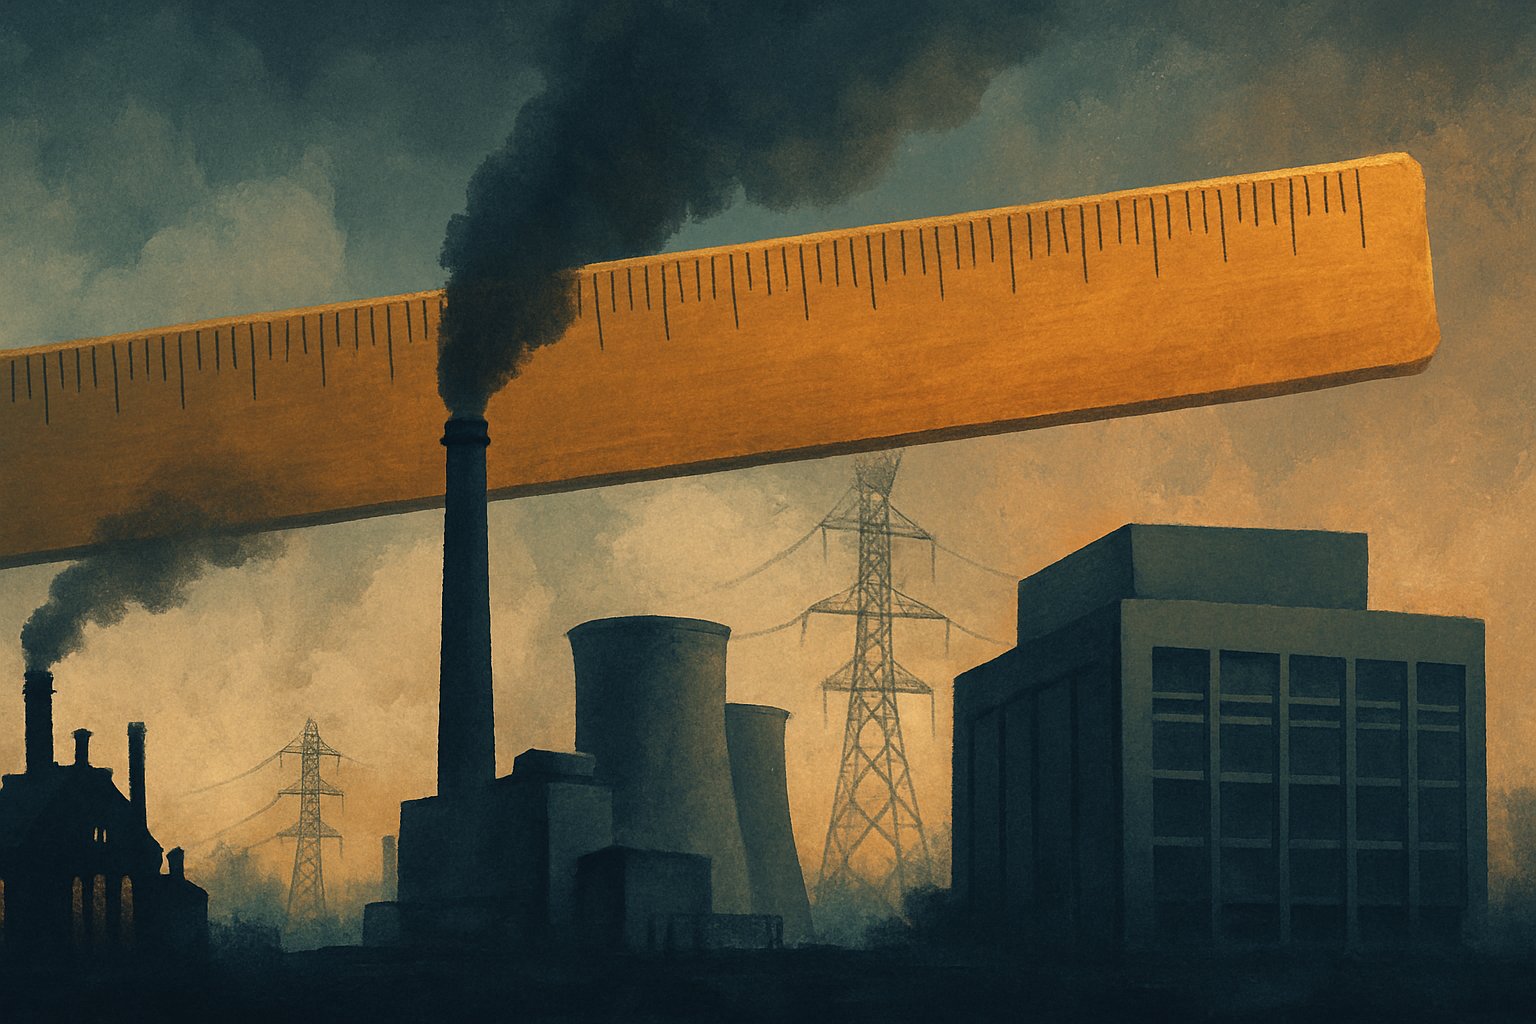
What the deck does give you is a usable ruler. If this is an age, you should see spending above the previous peaks (it is, on Coatue’s numbers), a bottleneck input that everyone is fighting over (it is, and the input is power), and toll-takers earning margins nobody has seen before (they are). The one measurement still pending is the one that pays for the rest: revenue per gigawatt of capex catching up to the 60-cent cloud benchmark.
That is a number you can check in a few years. Until then, the claim that this is an age rather than a cycle is a bet on one ratio.
Source and attribution. This post is commentary on Coatue’s Public Markets Update (October 7, 2026), published by Coatue Management at www.coatue.com/blog/perspective/public-markets-update-2026-10-07. The figures, slide titles and scenarios discussed belong to Coatue and are quoted for analysis; they are Coatue’s estimates, not mine, and not investment advice. Read the original deck and its disclosures before relying on any number here.
Chris Meredith writes about AI, technology, and what it actually means for real people. Follow along on Substack: monkeyattack.substack.com